Businesses often know they need “better data,” but the type of help they require is not always obvious. Data visualization services and BI consulting are closely related, yet they solve different problems. Choosing the wrong one can lead to attractive dashboards that do not influence decisions, or complex analytics programs that take too long to show value.
TLDR: If your data is already reliable and your main challenge is presenting it clearly, you likely need data visualization services. If your business has fragmented systems, unclear metrics, poor data governance, or no reporting strategy, BI consulting is the better fit. For example, a retail company with clean sales data might use visualization services to build executive dashboards in three weeks, while a company pulling reports manually from five systems may need BI consulting to reduce reporting time by 40% or more.
Understanding the Difference
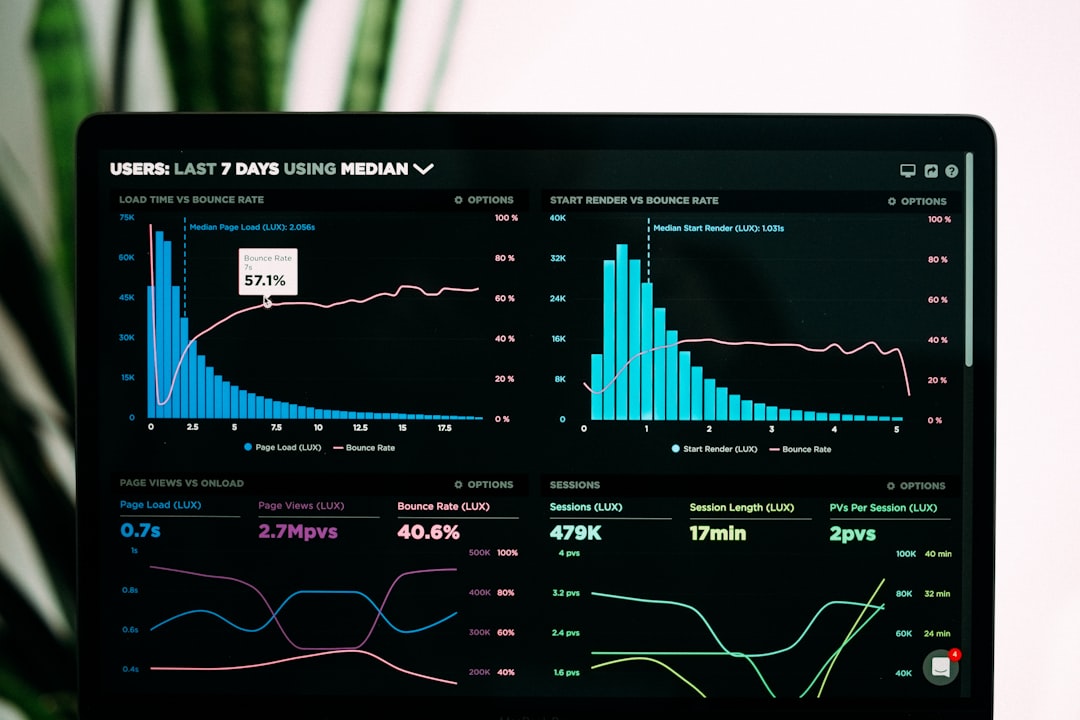
Data visualization services focus on turning data into clear, useful visual formats such as dashboards, charts, reports, scorecards, and interactive analytics views. The goal is to make information easier to understand and faster to act on. These services are often used when a company already has access to the right data but struggles to present it effectively.
BI consulting, or business intelligence consulting, is broader. It includes assessing business goals, defining key performance indicators, designing data models, integrating systems, improving data quality, selecting BI platforms, building dashboards, and creating long-term analytics strategies. BI consultants look not only at how data appears, but also at where it comes from, how trustworthy it is, and how it supports decision-making.
In simple terms: data visualization answers “How should we show the data?” while BI consulting answers “What data do we need, how do we manage it, and how do we use it to run the business better?”
When Data Visualization Services Are the Right Choice
Data visualization services are most valuable when your organization already has a reasonably stable data foundation. You may have a CRM, ERP, marketing analytics platform, spreadsheet model, or data warehouse that contains accurate information, but your reports are hard to read or too slow to interpret.
You should consider data visualization services if:
- Your data sources are already connected and generally reliable.
- Your metrics are clearly defined, such as revenue, churn, conversion rate, margin, or utilization.
- Your stakeholders need better dashboards for daily, weekly, or monthly decisions.
- Your current reports are too cluttered, overly technical, or difficult for executives to understand.
- You need faster adoption of analytics across teams through intuitive design.
For example, a SaaS company may already track monthly recurring revenue, customer acquisition cost, churn, and product usage. However, if these metrics are buried in spreadsheets or shown in inconsistent formats, leadership may still struggle to identify risk. A visualization team can design a clean dashboard that highlights trends, exceptions, and priorities at a glance.
The main benefit is speed. Visualization projects are often narrower in scope and can deliver results quickly. They can also improve trust in reporting by making information more consistent and easier to interpret, even if the underlying data environment remains unchanged.
When BI Consulting Is the Better Investment
BI consulting is the stronger choice when your analytics challenges are structural rather than cosmetic. If teams disagree about the numbers, reports take days to prepare, or data must be copied manually between systems, visualization alone will not solve the problem.
You should consider BI consulting if:
- Your data is spread across multiple systems with no single source of truth.
- Different departments calculate the same metric differently, causing confusion in meetings.
- Manual reporting consumes significant staff time every week or month.
- Your leadership team lacks confidence in the accuracy of reports.
- You need a scalable analytics strategy, not just a dashboard.
A manufacturing company, for instance, may need to combine production data, inventory levels, supplier performance, sales forecasts, and finance data. If these systems are not aligned, a dashboard may simply expose inconsistencies. A BI consultant would first assess data flows, define core metrics, recommend architecture, and then develop reporting that decision-makers can trust.

Key Differences in Scope
The most important distinction is scope. Data visualization services usually work at the presentation layer. They improve how users see and interact with information. BI consulting works across the full data value chain, from business requirements and data architecture to governance, reporting, training, and adoption.
Data visualization projects typically involve:
- Dashboard design and redesign
- Chart selection and visual storytelling
- Executive reporting layouts
- User experience improvements
- Interactive filters and drilldowns
BI consulting projects may involve:
- BI strategy and roadmap development
- Data source assessment and integration planning
- KPI definition and metric standardization
- Data warehouse or semantic model design
- Governance, security, and access control
- Platform selection and implementation support
This does not mean one is better than the other. It means they serve different levels of business need. Many companies eventually need both: BI consulting to build the foundation, and data visualization services to make insights accessible.
Cost, Timeline, and Business Impact
Data visualization engagements are usually faster and more contained. A small dashboard design project may take a few weeks, especially if data sources are ready. Costs are often easier to estimate because the work is focused on defined outputs.
BI consulting typically requires deeper discovery and broader coordination. Projects may involve IT, operations, sales, finance, and executive leadership. Timelines can range from several weeks for an assessment to several months for a full implementation. However, the impact can be substantial. Companies that reduce manual reporting, standardize KPIs, and improve data quality often gain faster planning cycles, fewer reporting disputes, and better operational visibility.
The key question is not simply cost. It is whether your business is paying for a visual improvement or for a decision-making system. If managers still debate whether the numbers are correct, a polished dashboard will not create confidence. If the numbers are trusted but poorly communicated, visualization may deliver the highest return.
How to Decide What Your Business Needs
Before engaging a provider, ask a few practical questions:
- Do we trust our current data? If not, start with BI consulting.
- Are our main KPIs clearly defined? If not, BI consulting can help create alignment.
- Are reports already accurate but difficult to understand? Data visualization services may be enough.
- Do we need to integrate multiple systems? BI consulting is likely required.
- Is the goal a dashboard, or a long-term analytics capability? The latter requires BI expertise.
A practical approach is to begin with a diagnostic review. Even a short assessment can reveal whether the problem is design, data quality, system integration, governance, or business alignment. This reduces the risk of investing in dashboards before the data foundation is ready.

Common Mistakes to Avoid
One common mistake is assuming that a new dashboard will automatically improve decisions. Dashboards only help when they show the right metrics, use trusted data, and fit into management routines. Another mistake is overbuilding a BI program when the immediate issue is simply poor report design. Not every company needs a complex data architecture project at the start.
It is also important to involve business users early. Analytics initiatives fail when they are driven only by technical requirements without understanding how teams actually make decisions. Finance, sales, marketing, operations, and leadership may each need different levels of detail. A good solution balances consistency with usability.
The Best Choice May Be a Phased Approach
For many organizations, the smartest path is phased. Start by clarifying business goals and data readiness. If the foundation is weak, use BI consulting to standardize metrics, improve data flows, and establish governance. Once the foundation is stable, invest in visualization to make insights engaging and actionable.
If your business already has clean data and aligned KPIs, there is no need to delay value with a large consulting initiative. Focus on better dashboards, clearer charts, and stronger data storytelling. But if your reporting process depends on manual work, inconsistent spreadsheets, or conflicting definitions, BI consulting should come first.
Ultimately, data visualization helps people see information clearly, while BI consulting helps organizations build the systems and standards behind that information. The right choice depends on the maturity of your data environment and the decisions you need to improve. A serious assessment of your current reporting challenges will point to the right investment—and prevent expensive work that solves the wrong problem.